Graphs from final report
- Demographics Summary table
- Graph 1: US and UK socio-economic status
- Graph 2: US and UK age
- Graph 3: US and UK Gender
- Graph 4: US and UK ethnicity
- Graph 5: UK vs US Conners'
- Graph 6: UK vs US stimulants manager aggressive behaviour
- Graph 7: UK vs US stimulants improve classroom performance
Demographics Summary table
|
|
|
|
|
|
||||
|
Participants
N=151 |
Gender |
|
Mean Age |
|
Mean SES |
|
Ethnicity |
|
|
United States
|
60.9% male
39.1% female |
|
11.41 years |
|
Class III-IV
(middle to lower-middle class) |
|
66.7% White
23.2% Black
10.1% Other |
|
|
United Kingdom |
80.5% male
19.5% female |
|
10.87 years |
|
Class III-IV
(middle to lower-middle class) |
|
86.6% White
3.7%
Black
9.8%
Other |
|
Summary Table : VOICES Study Participants Demographic characteristics
Description of Groups
Group
N
Group A
55
Group B
48
Group C
48
Total
151
55 participants were categorised as Group A (diagnosed and using medication), 48 as Group B (diagnosed, but no medication) and 48 as Group C (control group, no diagnosis).
(With graphs)
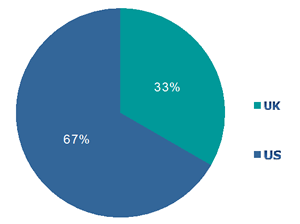
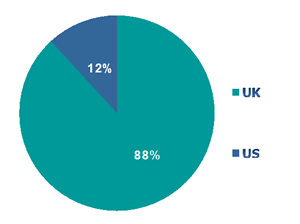
Country
N
United Kingdom
82
United States
69
Total
151
Graph 1: US and UK socio-economic status
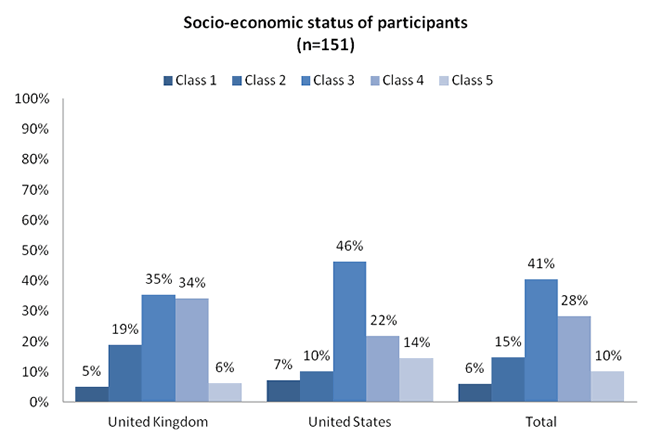
There was diversity in the socio-economic status of the study’s participants, with higher proportions in classes 3 (41%) and 4 (28%). There was no important difference in socio-economic status of participants from the United States and United Kingdom (p>.05).
Class description: Class 4-5 is middle class/upper class; class 3 is middle-class/lower-middle class; class 2 is lower-middle class/working class; and class 1 is working class/poor.
Class measured by the Hollingshead Four-Factor Index: class 1: 19-8; class 2: 29-20; class 3: 39-30; class 4: 54-40; class 5: 66-55.
Graph 2: US and UK age
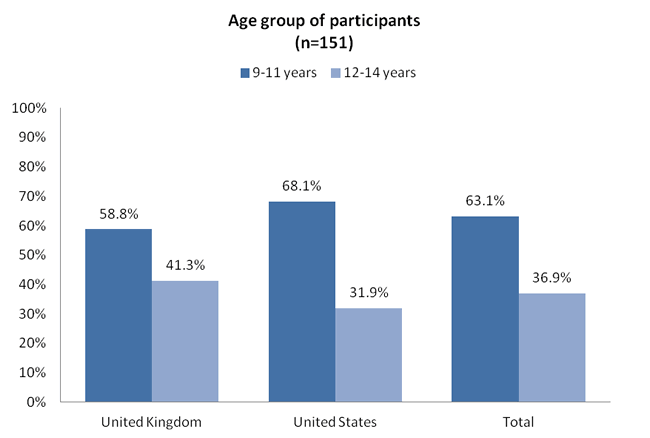
The participants’ age ranged from 9 to 14 years. Overall, 63% of the participants were aged between 9 and 11 years. The mean age was 11.2 overall. The mean age was slightly higher in the United Kingdom (M=11.41, SD=1.5) than in the United States (M=10.87, SD=1.6) and this difference was significant (p<.05).
Graph 3: US and UK Gender
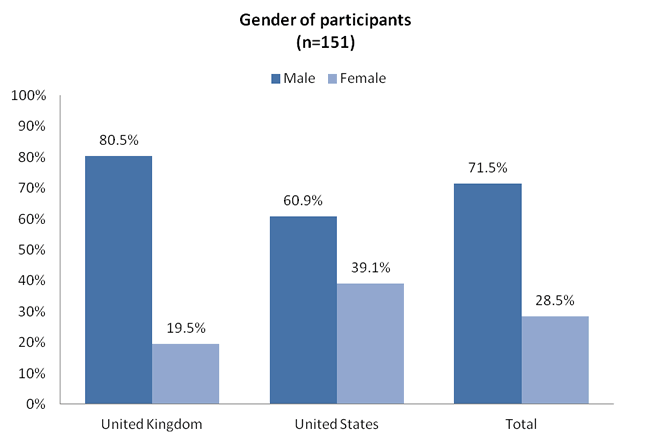
72% of participants were males. A higher proportion of UK participants were males (81%) compared to the US (61%) and this difference was significant (p<.01).
Graph 4: US and UK ethnicity
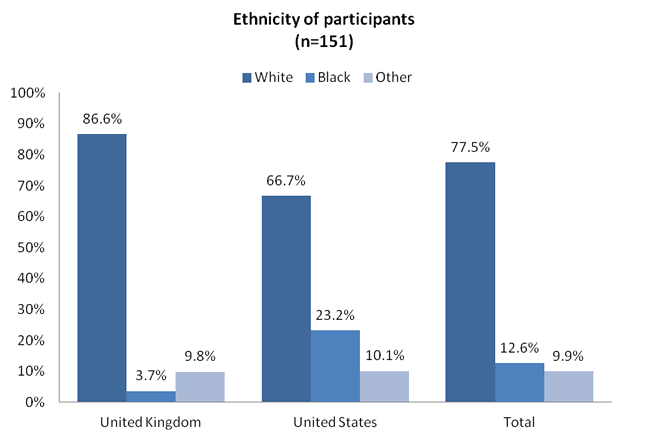
Overall, 78% of participants were categorised as being white, 13% as black and 10% as other. In the UK there was a higher participation of white kids (87%) compared to the US (67%), where a higher proportion was black (23%). The difference between the US and UK was significant (p<.01).
Graph 5: UK vs US Conners'
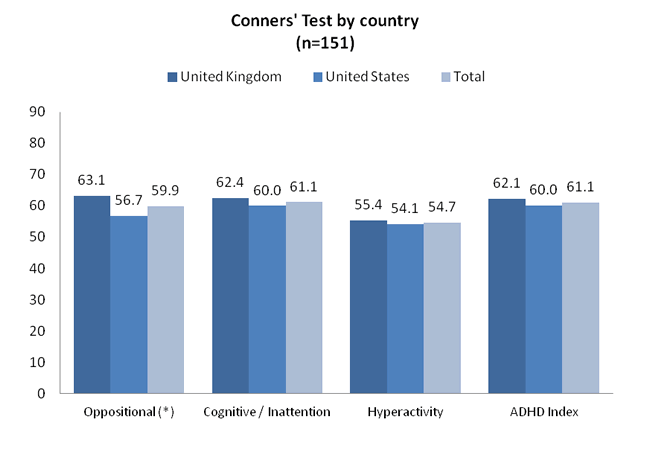
Participants in the UK scored significantly higher in the Conners’ Oppositional scale than participants in the US (63.1 and 56.7, respectively, p<.05).
Graph 6: UK vs US stimulants manager aggressive behaviour
Graph 7: UK vs US stimulants improve classroom performance